
Uniform Tracking Comes in Many Shapes and Sizes

Good Thursday morning, Uni Watchers. I hope everyone had a good Wednesday.
I’ll be hitting the road shortly — heading up to a Bonspiel (curling tournament) in Norfolk, CT, so if there is any breaking uni news in the next two days, it may need to wait for Anthony. I’ll have a bunch of articles today (and several tomorrow), but my time on the boards and my ability to cover any new news will be limited.
I’m back today with new Ticker Assistant Susan Freeman, who shares many of the same passions many of us Uni Watchers have. One of these is data visualization — which is the art/science of taking raw data and turning it into the form of a chart, diagram, picture, etc. I’ve always been a big fan of data visualization. (In fact, I don’t know if any of you subscribe to an excellent weekly newsletter from WaPo columnist Philip Bump called How To Read This Chart, but I highly recommend it. It’s free, and it appears in your inbox every Saturday morning at 10:00 am ET. Trust me, if you enjoy data visualization, this is for you!).
Susan, as she’ll explain below, has been into creating infographics for years, and she’s going to share a bit of that part of her life and some examples of her previous work. The graphics below are purposely cut off (“I tried to capture entertaining stuff because they would be too long or too cluttered or have gaps of incompleteness,” she told me), but they will give you a good idea of the full graphic.
There’s a lot to get to, so let’s get to know Susan a bit more as she brings us…
by Susan Freeman
I am a nerd and I love data – like many of us here. Phil just introduced me to the term “data visualization.” And wow, that is spot on and 100% explains my love for infographics. It is the perfect combination for me – blending the science and the art. I am an artist, but I am also a NASA engineer. And the world of data visualization allows both of those things to live comfortably and quite happily together. My whole life, whether I knew it or not, I have loved watching uniforms. Someone forwarded a Uni Watch article to my dad and he forwarded it to me. He was amazed and I was amazed – my God, there were others like me!
I am obsessed with the old Southwest Conference – my dad lived it, I lived it. It was special and quirky with fun mascots, hand signs, and GREAT football. So naturally, there came a time when I wanted to do some uni tracking. Well, at first it was more historical history as opposed to game to game uniforms (we will discuss that one on another day).
Uniform Tracking comes in many shapes and sizes. I have used various uniform templates and colored them in over the years – and yet have never been happy with any of them to track a uniform history. Although someone on Uni Watch uses that ’70s-feel baseball one I just love. But most of my uni documenting centers around that old Southwest Conference. For the young ones: Arkansas, Baylor, Houston, Rice, SMU, Texas, Texas A&M, TCU, and Texas Tech. So I am handling nine teams, not just one. Scrolling through pages and pages of uni drawings just doesn’t work for me.
One day I wanted a quick go-to visual reference for fact checking that would also be suitable for the creation of infographics. So I peeled off of the standard “guy in a uniform” tracking method and turned to Excel. I wanted color blocks. I find it extremely satisfying to make these kinds of charts in different styles to see the data from different angles. I love it – and they really are a go-to tool for me.
SWC HELMETS
It all started with wanting a one-page “graphic” of all the helmet stripes Texas Tech had worn including when the Red Raiders first wore their red facemasks. Yes, it pre-dates the Chargers! Texas Tech wore red facemasks in 1973 – one year before the Chargers wore yellow.

My first Excel documented history is designed in a timeline format and is intended to be a one-look sees all. It fits on my laptop screen. You progress from left to right once you have the first colored helmet (in this case 1949). The helmet stripe row, as you can see, is made from nine rows to effectively portray those beautiful stripes. There is a row for the older days when numbers dominated the sides of helmets in the ’50s and ’60s. And unfortunately I needed another row for alternate helmets because for three years (1949-50 and 1961) Tech wore RED helmets at road games. The chart originally was only intended for the years of the Southwest Conference. So that row came in useful when I expanded to years after 1995. Then there is a facemask row. And lastly a row to document when the Double-T premiered and when other major changes were done to the helmet logo.
Of course, I couldn’t stop there. I did this for all old Southwest Conference teams to varying levels of completeness. I don’t have all the logos embedded for all the teams yet. I would also like to document the years the clear MaxPro helmets were worn. I love seeing the contrast between the teams – the classic few changes of Arkansas and Texas against the colorful quilts Rice and TCU weave. That is all part of that data visualization – there are so many things to notice!
Arkansas is one of the classics.

Until Nike took over, Baylor was pretty classic too. Hell, Baylor has not even had a true gold helmet since 1996. And of course now, they use yellow.

The University of Houston was pretty consistent in the SWC days. They have bounced around a bit since then.

Rice, Rice, Rice!!! Oh what fun are the Rice uniforms in general…. lots of great helmets and logos. I still need to add about 5 R Diamond logos (and they only encompass 1984 and 1985…) as well as many others.

SMU was red at first and then they fell into their consistent red/white/blue striped look. It has been altered from time to time (those dark blue helmets were dark times…), but always comes back to their classic look (even when it’s a modern take). I need to add all the ponies on this one.

Texas – a true classic. This still needs some logos out to the right, but not many, obviously. Honestly, I cropped these so they looked the best and not cut off mid-logo/text – these charts include some random data and are not always quite as aesthetic without showing the whole history.

Texas A&M has varied it up enough to keep it interesting.

And TCU wove a quilt of pure fun in the old days. I still need more logos on this one.

And there is your first look into my view of uni tracking. Just a peek into the helmet histories of nine teams. I hope you enjoyed it. This is just the start – there is so much more to come. As I said above, there are so many ways to look at the very same data.
Readers? What say you?
Guess the Game from the Scoreboard
Guess The Game…
…From The Scoreboard
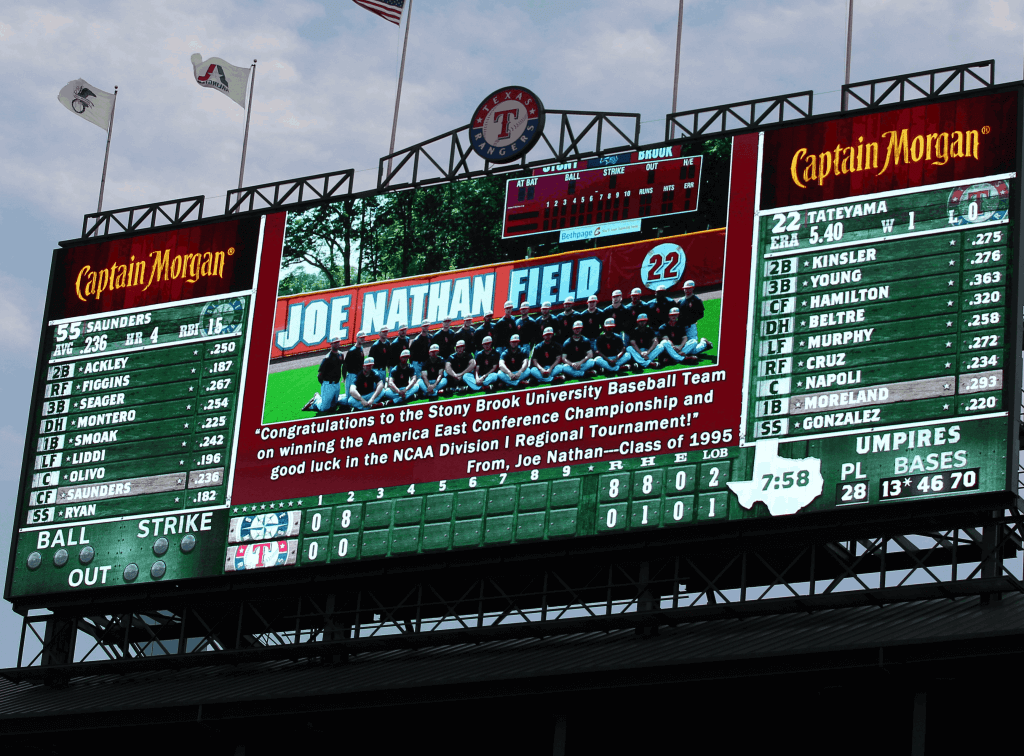
Today’s scoreboard comes from Scott Simpson.
The premise of the game (GTGFTS) is simple: I’ll post a scoreboard and you guys simply identify the game depicted. In the past, I don’t know if I’ve ever completely stumped you (some are easier than others).
Here’s the Scoreboard. In the comments below, try to identify the game (date and location, as well as final score). If anything noteworthy occurred during the game, please add that in (and if you were AT the game, well bonus points for you!):

Please continue sending these in! You’re welcome to send me any scoreboard photos (with answers please), and I’ll keep running them.
Guess the Game from the Uniform
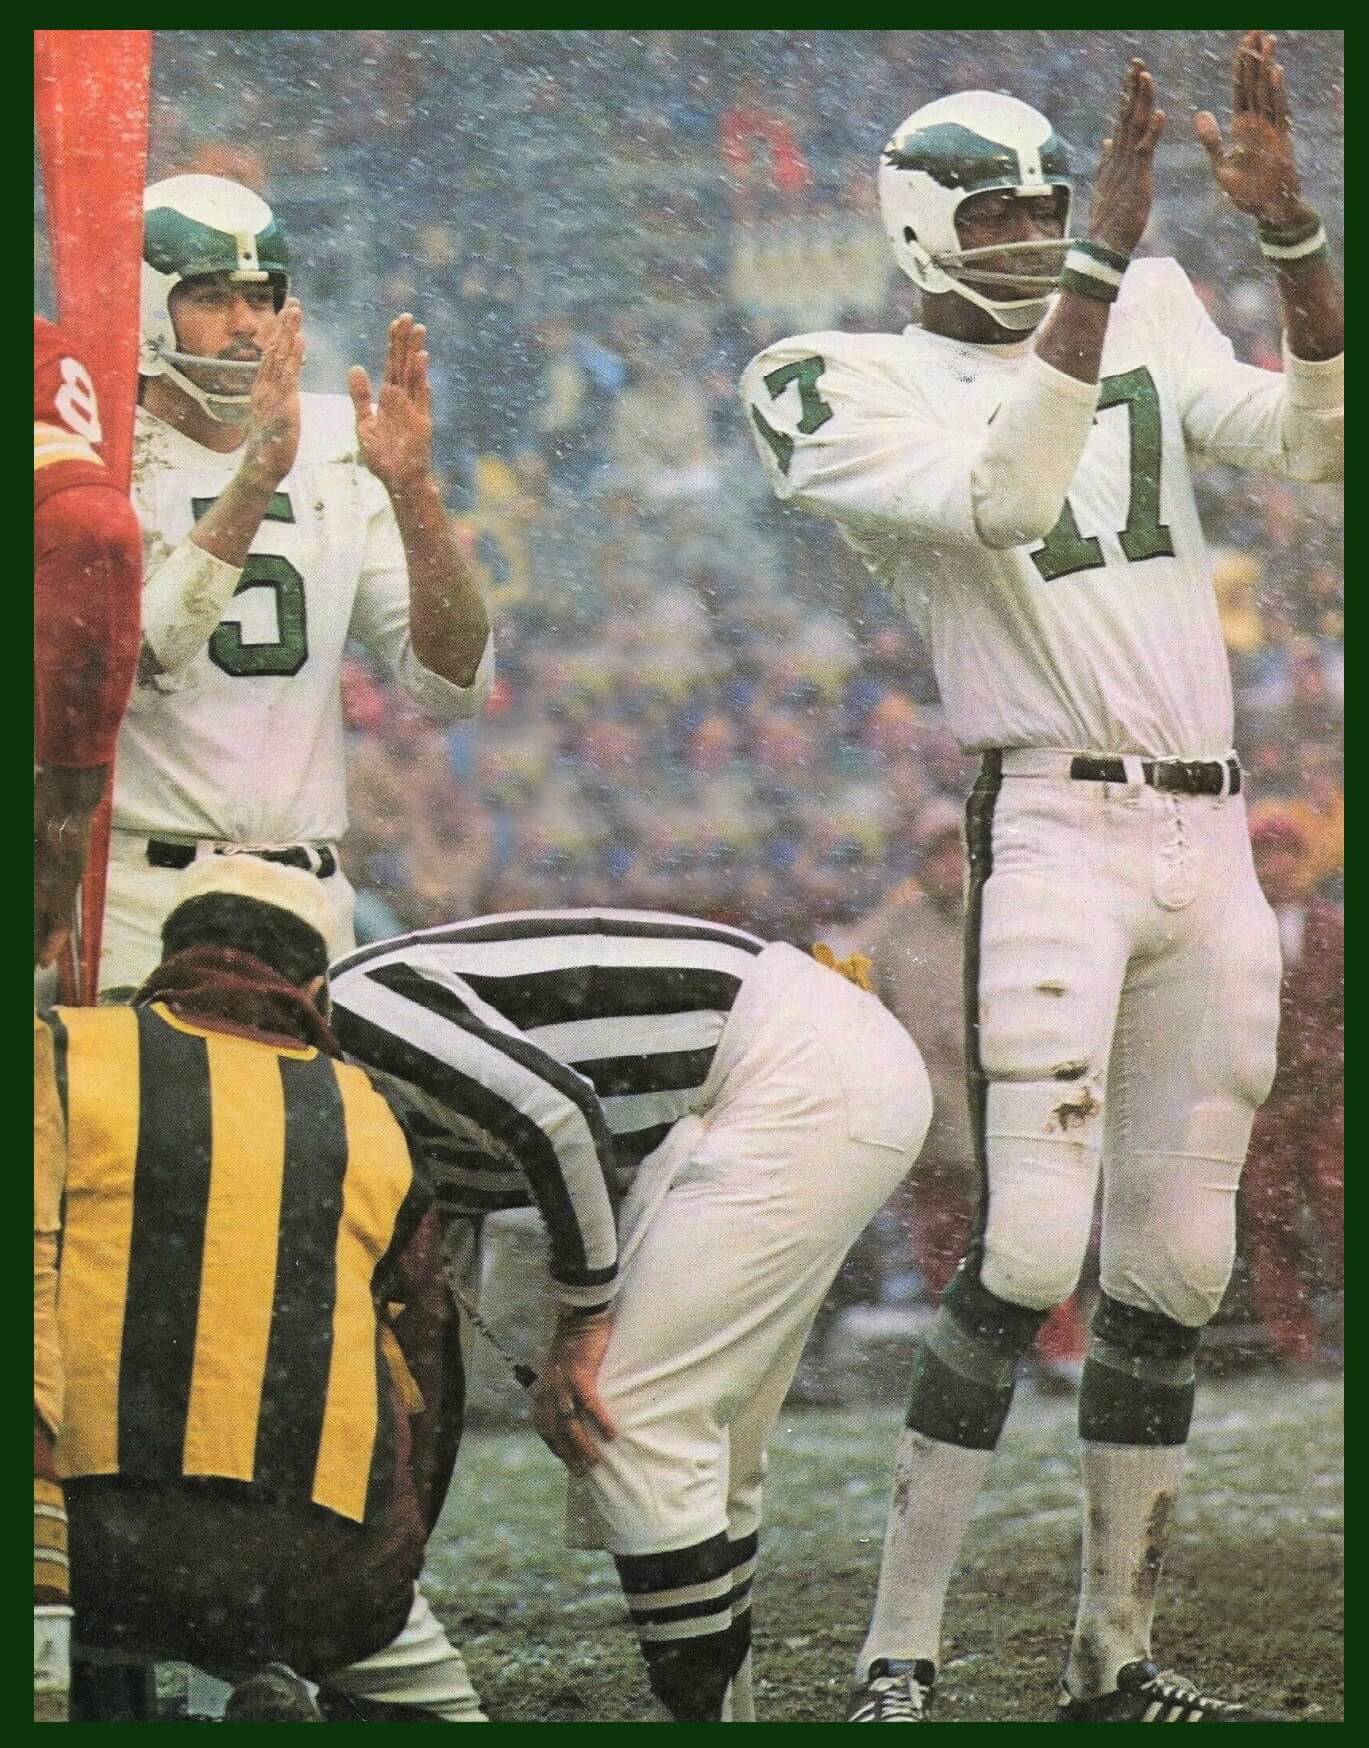
Based on the suggestion of long-time reader/contributor Jimmy Corcoran, we’ve introduced a new “game” on Uni Watch, which is similar to the popular “Guess the Game from the Scoreboard” (GTGFTS), only this one asked readers to identify the game based on the uniforms worn by teams.
Like GTGFTS, readers will be asked to guess the date, location and final score of the game from the clues provided in the photo. Sometimes the game should be somewhat easy to ascertain, while in other instances, it might be quite difficult. There will usually be a visual clue (something odd or unique to one or both of the uniforms) that will make a positive identification of one and only one game possible. Other times, there may be something significant about the game in question, like the last time a particular uniform was ever worn (one of Jimmy’s original suggestions). It’s up to YOU to figure out the game and date.
Today’s GTGFTU comes from Sam McEwen.

Good luck and please post your guess/answer in the comments below.
And finally…
…that’ll do it for the early lede. Big thanks, again, to Susan for an introduction to her and her passion for infographics! I have a hunch more than a few of you guys also enjoy data visualization — if you’re one, be sure to chime in.
As I mentioned at the top, I’ll be heading up to Connecticut later today so I’ll have very limited time online (apologies in advance) should there be any big uni news. As I noted, it may need to wait for Anthony. But I’ll still have a bunch of articles the next two days, including a new Collector’s Corner this morning, so be sure to keep checking back throughout the day.
See you guys tomorrow.
Peace,
PH
link


